
")
SweetBunFactory
Investment Thesis
SPDR S&P Semiconductor ETF (NYSEARCA:XSD) warrants a buy rating due to its unique modified equal-weight holdings strategy. As a result of this approach, XSD has a greater inclusion of small and mid-cap semiconductor companies, many of which demonstrate strong fundamental qualities. Additionally, XSD is lighter on large and mega-cap chipmakers which have seen steep price run-ups recently leading to high valuations. Compared to historical metrics, small caps are currently undervalued compared to large caps despite their ability to outperform large caps over the past century. Therefore, XSD may be well positioned for stronger performance compared to peer semiconductors ETFs looking forward.
Fund Overview and Compared ETFs
XSD is an ETF that seeks to track the SPDR S&P Semiconductor Select Industry Index. With its inception in 2006, the fund has 39 holdings and $1.66B in AUM. A key characteristic of the fund is that it provides unconcentrated industry exposure with a more equal distribution among large, mid, and small cap stocks. For comparison purposes, other funds examined are VanEck Semiconductor ETF (SMH), Invesco Semiconductors ETF (PSI), and iShares Semiconductor ETF (SOXX). Each of these compared funds are focused on the semiconductor industry and have between 25 and 40 holdings. However, the key difference is their market cap weight approach. While, XSD utilizes a modified equal-weight strategy, funds like SMH have almost 20% of its weight on NVIDIA (NVDA). As a result, SMH’s weight is 100% on large cap and the fund has no small cap companies. PSI consists of 50.6% large cap holdings and 38.7% small cap. Finally, SOXX is also heavier on large cap holdings than small caps.
Performance, Expense Ratio, and Dividend Yield
The semiconductor industry has seen tremendous growth over the past decade. Consequently, XSD has seen a 10-year compound annual growth rate, or CAGR, of 21.38%. However, this is still sub-par compared to peer funds. SMH has seen the strongest performance with a 28.03% 10-year CAGR. PSI and SOXX have also seen strong returns with 24.36% and 25.40% 10-year average annual returns respectively. However, as I will discuss later, XSD has several competitive advantages compared to these higher performing peers.
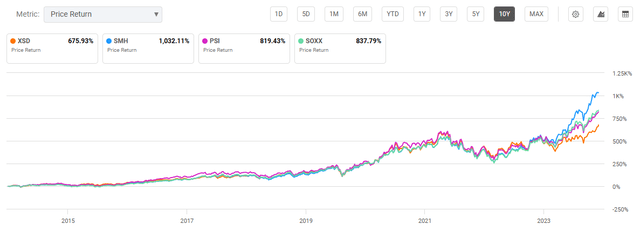
10-Year Total Price Return: XSD and Compared Semiconductor Exchange-Traded Funds (Seeking Alpha)
XSD has fees roughly on par with peer competitors with an expense ratio of 0.35%. As most semiconductor companies are focused on reinvesting profits for further growth, dividend yields are low. XSD provides a mere 0.21% dividend yield, which is not uncommon for similar ETFs.
Expense Ratio, AUM, and Dividend Yield Comparison
|
XSD |
SMH |
PSI |
SOXX |
|
|
Expense Ratio |
0.35% |
0.35% |
0.57% |
0.35% |
|
AUM |
$1.66B |
$24.14B |
$973.07M |
$16.27B |
|
Dividend Yield TTM |
0.20% |
0.38% |
0.19% |
0.56% |
|
Dividend Growth 5 YR CAGR |
-5.25% |
4.95% |
-0.76% |
12.56% |
Source: Seeking Alpha, 16 Jul 24
XSD Holdings and Key Outlook Factors
XSD is the most diversified among peers with 39 holdings. In terms of top holdings, XSD has few similarities with peer ETFs. While NVDA is a top holding for most compared funds, it stands at XSD’s #23 holding at just 2.84% weight. Additionally, only Advanced Micro Devices (AMD), Intel (INTC), and Credo Technology Group (CRDO) are found in the other ETF’s top 10 holdings. Finally, Broadcom (AVGO) is absent from XSD which is a top holding in all other peer funds.
Top 10 Holdings for XSD and Compared Semiconductor ETFs (Key Differences Bolded)
|
XSD – 39 holdings |
SMH – 26 holdings |
PSI – 31 holdings |
SOXX – 30 holdings |
|
SMTC – 3.56% |
NVDA – 19.75% |
AVGO – 5.54% |
AVGO – 9.28% |
|
PI – 3.39% |
TSM – 13.23% |
NVDA – 5.14% |
NVDA – 8.42% |
|
CRDO – 3.30% |
AVGO – 7.91% |
AMAT – 5.07% |
AMD – 7.75% |
|
OLED – 3.30% |
AMD – 5.40% |
LRCX – 5.03% |
AMAT – 6.50% |
|
CRUS – 3.29% |
ASML – 4.79% |
AMD – 4.78% |
QCOM – 5.81% |
|
RMBS – 3.29% |
INTC – 4.59% |
ADI – 4.65% |
LRCX – 4.12% |
|
ALGM – 3.26% |
AMAT – 4.48% |
MU – 4.50% |
TSM – 4.08% |
|
INTC – 3.26% |
TXN – 4.39% |
QCOM – 4.46% |
KLAC – 4.06% |
|
AMD – 3.25% |
LRCX – 4.32% |
CRDO – 3.98% |
INTC – 4.02% |
|
QRVO – 3.24% |
QCOM – 4.19% |
AMKR – 3.20% |
MRVL – 3.91% |
Source: Multiple, compiled by author on 16 Jul 24
The holding differences noted above are arguably strengths for XSD rather than weaknesses. While the overall semiconductor industry is expecting continued strong growth, the massive run-up in share prices for popular semiconductor companies has produced relatively unattractive valuations. In contrast, XSD’s modified equal weight has driven a relatively lower overall valuation.
Outlook Factor #1: Semiconductor Industry
The first key consideration factor is the outlook for the semiconductor industry. The growth we have seen over the past 10-15 years has been astounding but not unsubstantiated. Semiconductor companies produce chips that are critical in industries including automotive, computation and storage, wireless, AI, and cloud computing. Looking forward, this growth is not expected to slow anytime soon. Forecast revenue growth ranges from 6-10% through 2030 with high EBITDA margins also expected.
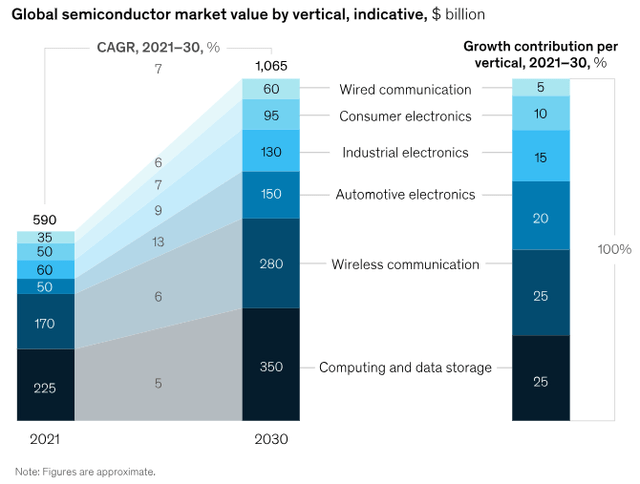
Forecast Growth of Semiconductor Market Through 2030 (www.McKinsey.com)
The automotive industry alone is expecting that its consumption of semiconductors will produce revenues of $200B annually by mid-2030. NVIDIA has been perhaps the best-known company to take advantage of this growth. NVDA hit a market cap of over $3T, pushing past other mega-cap IT companies towards the top of the S&P 500 Index this year.
Outlook Factor #2: High Valuations Cannot Be Ignored
Despite the massive growth for top semiconductor companies, their valuations have also reached high levels. As shown in the figure below, NVDA’s price return is considerably pronounced compared to XSD’s top five holdings. I covered SMH, the heaviest on NVDA, as a strong buy back in January of this year. At that time, NVDA was trading at roughly $48 per share. The chipmaker is now selling at over $126 per share.
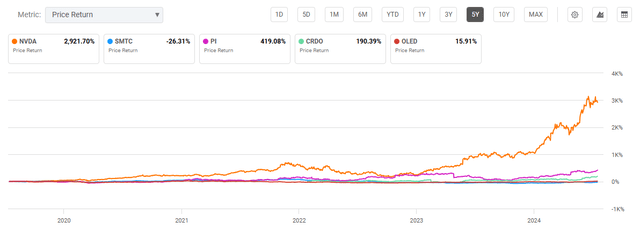
5-Year Total Price Return for NVDA vs. XSD’s Top 5 Holdings (Seeking Alpha)
However, NVDA’s price return is not unfounded. NVIDIA saw a 581% increase in net income between January 2023 and January 2024 alone. This increase in income, among other factors, has driven NVDA’s P/E to over 75. However, several of XSD’s top companies have strong fundamentals with much more attractive valuations. Rambus Inc. (RMBS), for example, is a top holding for XSD and is also showing strong profitability with a 78% net income margin. However, the mid-cap semiconductor company stands at a mere 20 P/E ratio.
Outlook Factor #3: Large vs. Small Cap Gap
More holistically, the difference in valuation between large or mega cap companies and small caps across the market is concerning. This can be measured by the difference between the S&P 500 and the S&P 600, which have forward P/E values of 21.3 and 13.9 respectively. Importantly, the last time this difference was so great was just prior to the “dot-com bubble.” Following this bubble, large cap companies saw steep declines while small caps performed better. This would serve XSD well as the fund is the heaviest on small cap companies of the ETFs compared.
Over the past 100 years, small caps have actually historically outperformed large caps. As shown in the chart below, the growth of $100 from 1926 to 2022 produced immensely different returns. Therefore, while the greatest price returns in the market recently have been with mega-caps, XSD may be well postured if we revert to the long-term historic trend.
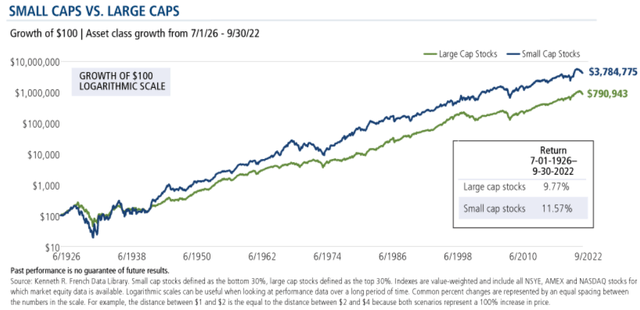
Growth of $100 Invested in Small vs. Large Caps, 1926-2022 (Kenneth R. French Data Library, www.calamos.com)
Current Valuation
During my previous coverage of SMH at the beginning of this year, XSD and peer funds had a relatively similar valuation. XSD’s price-to-earnings ratio of 29.95 at the start of 2024 was the highest of peer funds. Even SMH, which has seen the greatest growth since then, had a lower P/E ratio.
Valuation of Compared Semiconductor ETFs at the Beginning of 2024
|
XSD |
SMH |
PSI |
SOXX |
|
|
P/E ratio |
29.95 |
28.31 |
23.16 |
28.33 |
|
P/B ratio |
4.26 |
6.06 |
3.73 |
5.41 |
Source: Compiled by Author from Multiple Sources, 31 Dec 23
Since the start of the year, each fund has seen dramatically different returns. XSD is the only semiconductor ETF to underperform the market overall, as measured by the S&P 500. In contrast, SMH has seen a price return of over 70% due to its heavy weight on NVDA.
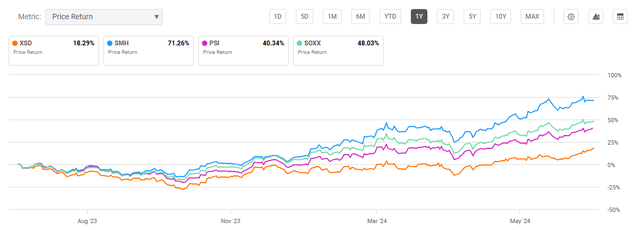
One Year Price Return Difference: XSD and Compared Semiconductor ETFs (Seeking Alpha)
As a result of the above price returns, each fund has a less desirable valuation compared to the P/E and P/B ratios seen at the start of the calendar year. However, XSD has the most attractive valuation with a P/E of roughly 35. SMH now has the least attractive, with a P/E over 42. Given XSD’s lower weight on NVDA and TSM, the fund has the right mix looking forward to capture industry growth without the higher risk of correction.
Current Valuation Metrics for XSD and Peer Competitors
|
XSD |
SMH |
PSI |
SOXX |
|
|
P/E ratio |
35.22 |
42.54 |
37.43 |
38.29 |
|
P/B ratio |
4.49 |
7.16 |
4.88 |
6.49 |
Source: Compiled by Author from Multiple Sources, 16 Jul 24
Risks to Investors
SMH, the best performing peer fund, has a beta value of 1.58 and standard deviation of 34.15%. In contrast, XSD has seen a 10-year beta value of 1.44 and a standard deviation of 27.67%. Therefore, there is quantifiably lower risk seen with XSD compared to SMH. However, a key risk factor to my thesis is that XSD continues to underperform peer funds that pursue a cap-weighted strategy. However, as discussed, this will only exacerbate the disparity in valuations. Therefore, I believe this risk factor is mitigated in the current valuation of each fund. While XSD may see potentially lower performance, its current valuation provides a buffer of protection in the event of a significant market correction or bear market.
Concluding Summary
The semiconductor industry has seen tremendous growth, with no significant signs of stopping. All funds discussed in this article have captured this growth to different degrees. While SMH has seen the best performance, it risks overvaluation due to its heavy weight on mega-cap companies, including NVDA. In contrast, XSD utilizes a modified equal-weight strategy with greater incorporation of small and mid-cap semiconductor companies. Due to the historically high gap between the S&P 500 and S&P 600, as well as other historical trend factors, the market is at significant risk of correction, particularly for companies with large market capitalizations. Therefore, XSD warrants a buy rating due to its ability to continue capturing semiconductor growth but at a more reasonable valuation with lower risk of major correction.
link